Welcome to the March 2025 Chester County Real Estate Market Update! This month's report provides a comprehensive overview of the county's active housing market. We're seeing a trend of homes selling quickly, with a median of just nine days on the market, indicating strong buyer demand. While most homes sold near their asking price, strategic pricing remains crucial, as price reductions were a factor in many transactions. This report dives into key metrics including average and median sale prices, days on market, and financing trends, offering valuable insights for anyone looking to navigate the Chester County real estate scene. Explore the details below to understand the dynamics of this sellers' market and how it might impact your real estate goals. To understand how these trends impact your real estate goals, call Trago Realty today for a personalized consultation.
March 2025 Chester County Real Estate Market Report: Key Data Points
Here's a straightforward look at the Chester County Residential Real Estate Market activity for March 2025, based on the latest data:
• Current Price Average: $833,078
• Current Price Median: $625,000
• Months Supply of Inventory: 3 months
• Sale Price-to-Original Price Ratio: 100.75%
• Days to Sell Average: 24 days
• Days to Sell Median: 6 days
• Cumulative Days on Market Average: 27 days
• Cumulative Days on Market Median: 6 days
• Number of Price Reductions: 150
• Reduced Price-to-Original Ask Ratio Average: 93.72%
• Reduced Price-to-Original Ask Ratio Median: 95.64%
• Number of Closed Sales: 369
Mortgage & Payment Types (March 2025):
• Adjustable Rate Mortgage: 0.27%
• Cash: 28.46%
• Conventional: 65.04%
• Exchange Trade: 0.27%
• FHA: 2.44%
• Other: 1.36%
• PHFA: 0.54%
• Private: 0.27%
• VA: 1.36%
Key Observations:
• Both the average and median sale prices saw significant increases from February to March.
• The supply of available homes decreased further, indicating tighter inventory.
• Homes sold at a slightly higher percentage of their original list price on average.
• The time it took for homes to sell decreased, with the median dropping to just 6 days.
• The number of closed sales increased substantially, reflecting a more active market.
Average Sold Price: $416,597
Sold Price-to-List Price: 96.43%
Cumulative Days on Market: 35
🟢 Franklin Twp (1 Sale): $400,000 | 88.89% | 6 days
🟢 London Britain Twp (1 Sale): $461,000 | 102.67% | 4 days
🟢 London Grove Twp (1 Sale): $387,500 | 96.90% | 40 days
🟢 New London Twp (3 Sales): $468,333 | 88.77% | 69 days
🟢 Penn Twp (7 Sales): $394,608 | 99.83% | 28 days
Average Sold Price: $344,065
Sold Price-to-List Price: 99.35%
Cumulative Days on Market: 28
🟢 Caln Twp (14 Sales): $423,354 | 99.88% | 35 days
🟢 Coatesville City (8 Sales): $205,113 | 100.31% | 11 days
🟢 E Fallowfield Twp (4 Sales): $373,725 | 96.79% | 65 days
🟢 Sadsbury Twp (5 Sales): $416,050 | 100.89% | 46 days
🟢 South Coatesville Boro (2 Sales): $347,500 | 102.99% | 6 days
🟢 Valley Twp (16 Sales): $331,431 | 100.63% | 18 days
🟢 West Brandywine Twp (7 Sales): $280,286 | 94.52% | 42 days
🟢 West Caln Twp (6 Sales): $371,521 | 98.21% | 17 days
Average Sold Price: $602,300
Sold Price-to-List Price: 101.61%
Cumulative Days on Market: 21
🟢 Downingtown Boro (5 Sales): $327,060 | 104.11% | 7 days
🟢 E Brandywine Twp (10 Sales): $684,792 | 97.15% | 31 days
🟢 E Caln Twp (5 Sales): $493,500 | 99.07% | 40 days
🟢 U Uwchlan Twp (5 Sales): $859,700 | 100.81% | 33 days
🟢 Uwchlan Twp (9 Sales): $571,056 | 102.68% | 6 days
🟢 Wallace Twp (2 Sales): $900,950 | 116.22% | 3 days
🟢 West Bradford Twp (5 Sales): $526,200 | 104.11% | 24 days
🟢 West Pikeland Twp (1 Sale): $475,000 | 98.96% | 6 days
Average Sold Price: $824,308
Sold Price-to-List Price: 102.56%
Cumulative Days on Market: 42
🟢 Charlestown Twp (4 Sales): $1,358,935 | 100.46% | 71 days
🟢 E Whiteland Twp (10 Sales): $648,904 | 102.78% | 16 days
🟢 Malvern Boro (4 Sales): $682,500 | 103.10% | 15 days
🟢 Willistown Twp (4 Sales): $870,000 | 103.58% | 107 days
Average Sold Price: $641,028
Sold Price-to-List Price: 96.15%
Cumulative Days on Market: 38
🟢 E Marlboro Twp (3 Sales): $570,333 | 101.16% | 59 days
🟢 Kennett Square Boro (1 Sale): $312,120 | 113.50% | 11 days
🟢 Kennett Twp (1 Sale): $722,528 | 97.32% | 45 days
🟢 New Garden Twp (3 Sales): $553,625 | 86.86% | 15 days
Average Sold Price: $382,214
Sold Price-to-List Price: 104.60%
Cumulative Days on Market: 27
🟢 Atglen Boro (2 Sales): $363,000 | 109.53% | 7 days
🟢 Highland Twp (1 Sale): $353,000 | 105.37% | 3 days
🟢 Londonderry Twp (1 Sale): $505,000 | 95.30% | 155 days
🟢 Parkesburg Boro (2 Sales): $389,500 | 104.12% | 7 days
🟢 West Sadsbury Twp (1 Sale): $312,500 | 104.20% | 4 days
Average Sold Price: $612,537
Sold Price-to-List Price: 100.26%
Cumulative Days on Market: 34
🟢 E Coventry Twp (4 Sales): $582,725 | 96.03% | 35 days
🟢 E Vincent Twp (4 Sales): $619,172 | 101.75% | 34 days
🟢 N Coventry Twp (2 Sales): $570,000 | 98.14% | 113 days
🟢 S Coventry Twp (1 Sale): $410,000 | 109.33% | 7 days
🟢 Warwick Twp (2 Sales): $519,000 | 100.67% | 8 days
🟢 West Vincent Twp (3 Sales): $801,667 | 102.01% | 5 days
Average Sold Price: $456,594
Sold Price-to-List Price: 104.14%
Cumulative Days on Market: 21
🟢 E Nottingham Twp (6 Sales): $545,067 | 111.31% | 22 days
🟢 Elk Twp (2 Sales): $570,500 | 104.11% | 4 days
🟢 Lower Oxford Twp (5 Sales): $510,138 | 98.89% | 30 days
🟢 Oxford Boro (2 Sales): $280,000 | 104.17% | 6 days
🟢 West Nottingham Twp (2 Sales): $120,000 | 95.71% | 30 days
Average Sold Price: $449,553
Sold Price-to-List Price: 99.87%
Cumulative Days on Market: 36
🟢 E Pikeland Twp (6 Sales): $572,417 | 101.45% | 21 days
🟢 Phoenixville Boro (20 Sales): $451,952 | 99.97% | 41 days
🟢 Schuylkill Twp (3 Sales): $187,833 | 96.03% | 27 days
Average Sold Price: $395,833
Sold Price-to-List Price: 101.85%
Cumulative Days on Market: 31
🟢 Spring City Boro (3 Sales): $395,833 | 101.85% | 31 days
Average Sold Price: $881,461
Sold Price-to-List Price: 103.64%
Cumulative Days on Market: 19
🟢 Easttown Twp (8 Sales): $1,382,625 | 101.88% | 41 days
🟢 Tredyffrin Twp (25 Sales): $721,088 | 104.20% | 13 days
Average Sold Price: $470,265
Sold Price-to-List Price: 97.95%
Cumulative Days on Market: 61
🟢 Elverson Boro (1 Sale): $413,000 | 104.58% | 3 days
🟢 Honeybrook Twp (7 Sales): $474,235 | 96.94% | 79 days
🟢 West Nantmeal Twp (3 Sales): $480,088 | 98.09% | 40 days
Average Sold Price: $864,330
Sold Price-to-List Price: 99.91%
Cumulative Days on Market: 47
🟢 Birmingham Twp (6 Sales): $857,800 | 98.99% | 59 days
🟢 Pennsbury Twp (2 Sales): $994,750 | 102.47% | 5 days
🟢 Pocopson Twp (1 Sale): $650,000 | 96.30% | 97 days
🟢 West Marlboro Twp (1 Sale): $857,000 | 103.88% | 4 days
Average Sold Price: $780,636
Sold Price-to-List Price: 101.40%
Cumulative Days on Market: 15
🟢 E Bradford Twp (7 Sales): $837,879 | 102.67% | 5 days
🟢 E Goshen Twp (16 Sales): $562,469 | 101.32% | 30 days
🟢 West Chester Boro (6 Sales): $535,917 | 104.33% | 7 days
🟢 West Goshen Twp (27 Sales): $922,553 | 100.12% | 12 days
🟢 West Whiteland Twp (18 Sales): $852,669 | 101.44% | 13 days
🟢 Westtown Twp (8 Sales): $709,375 | 102.42% | 13 days
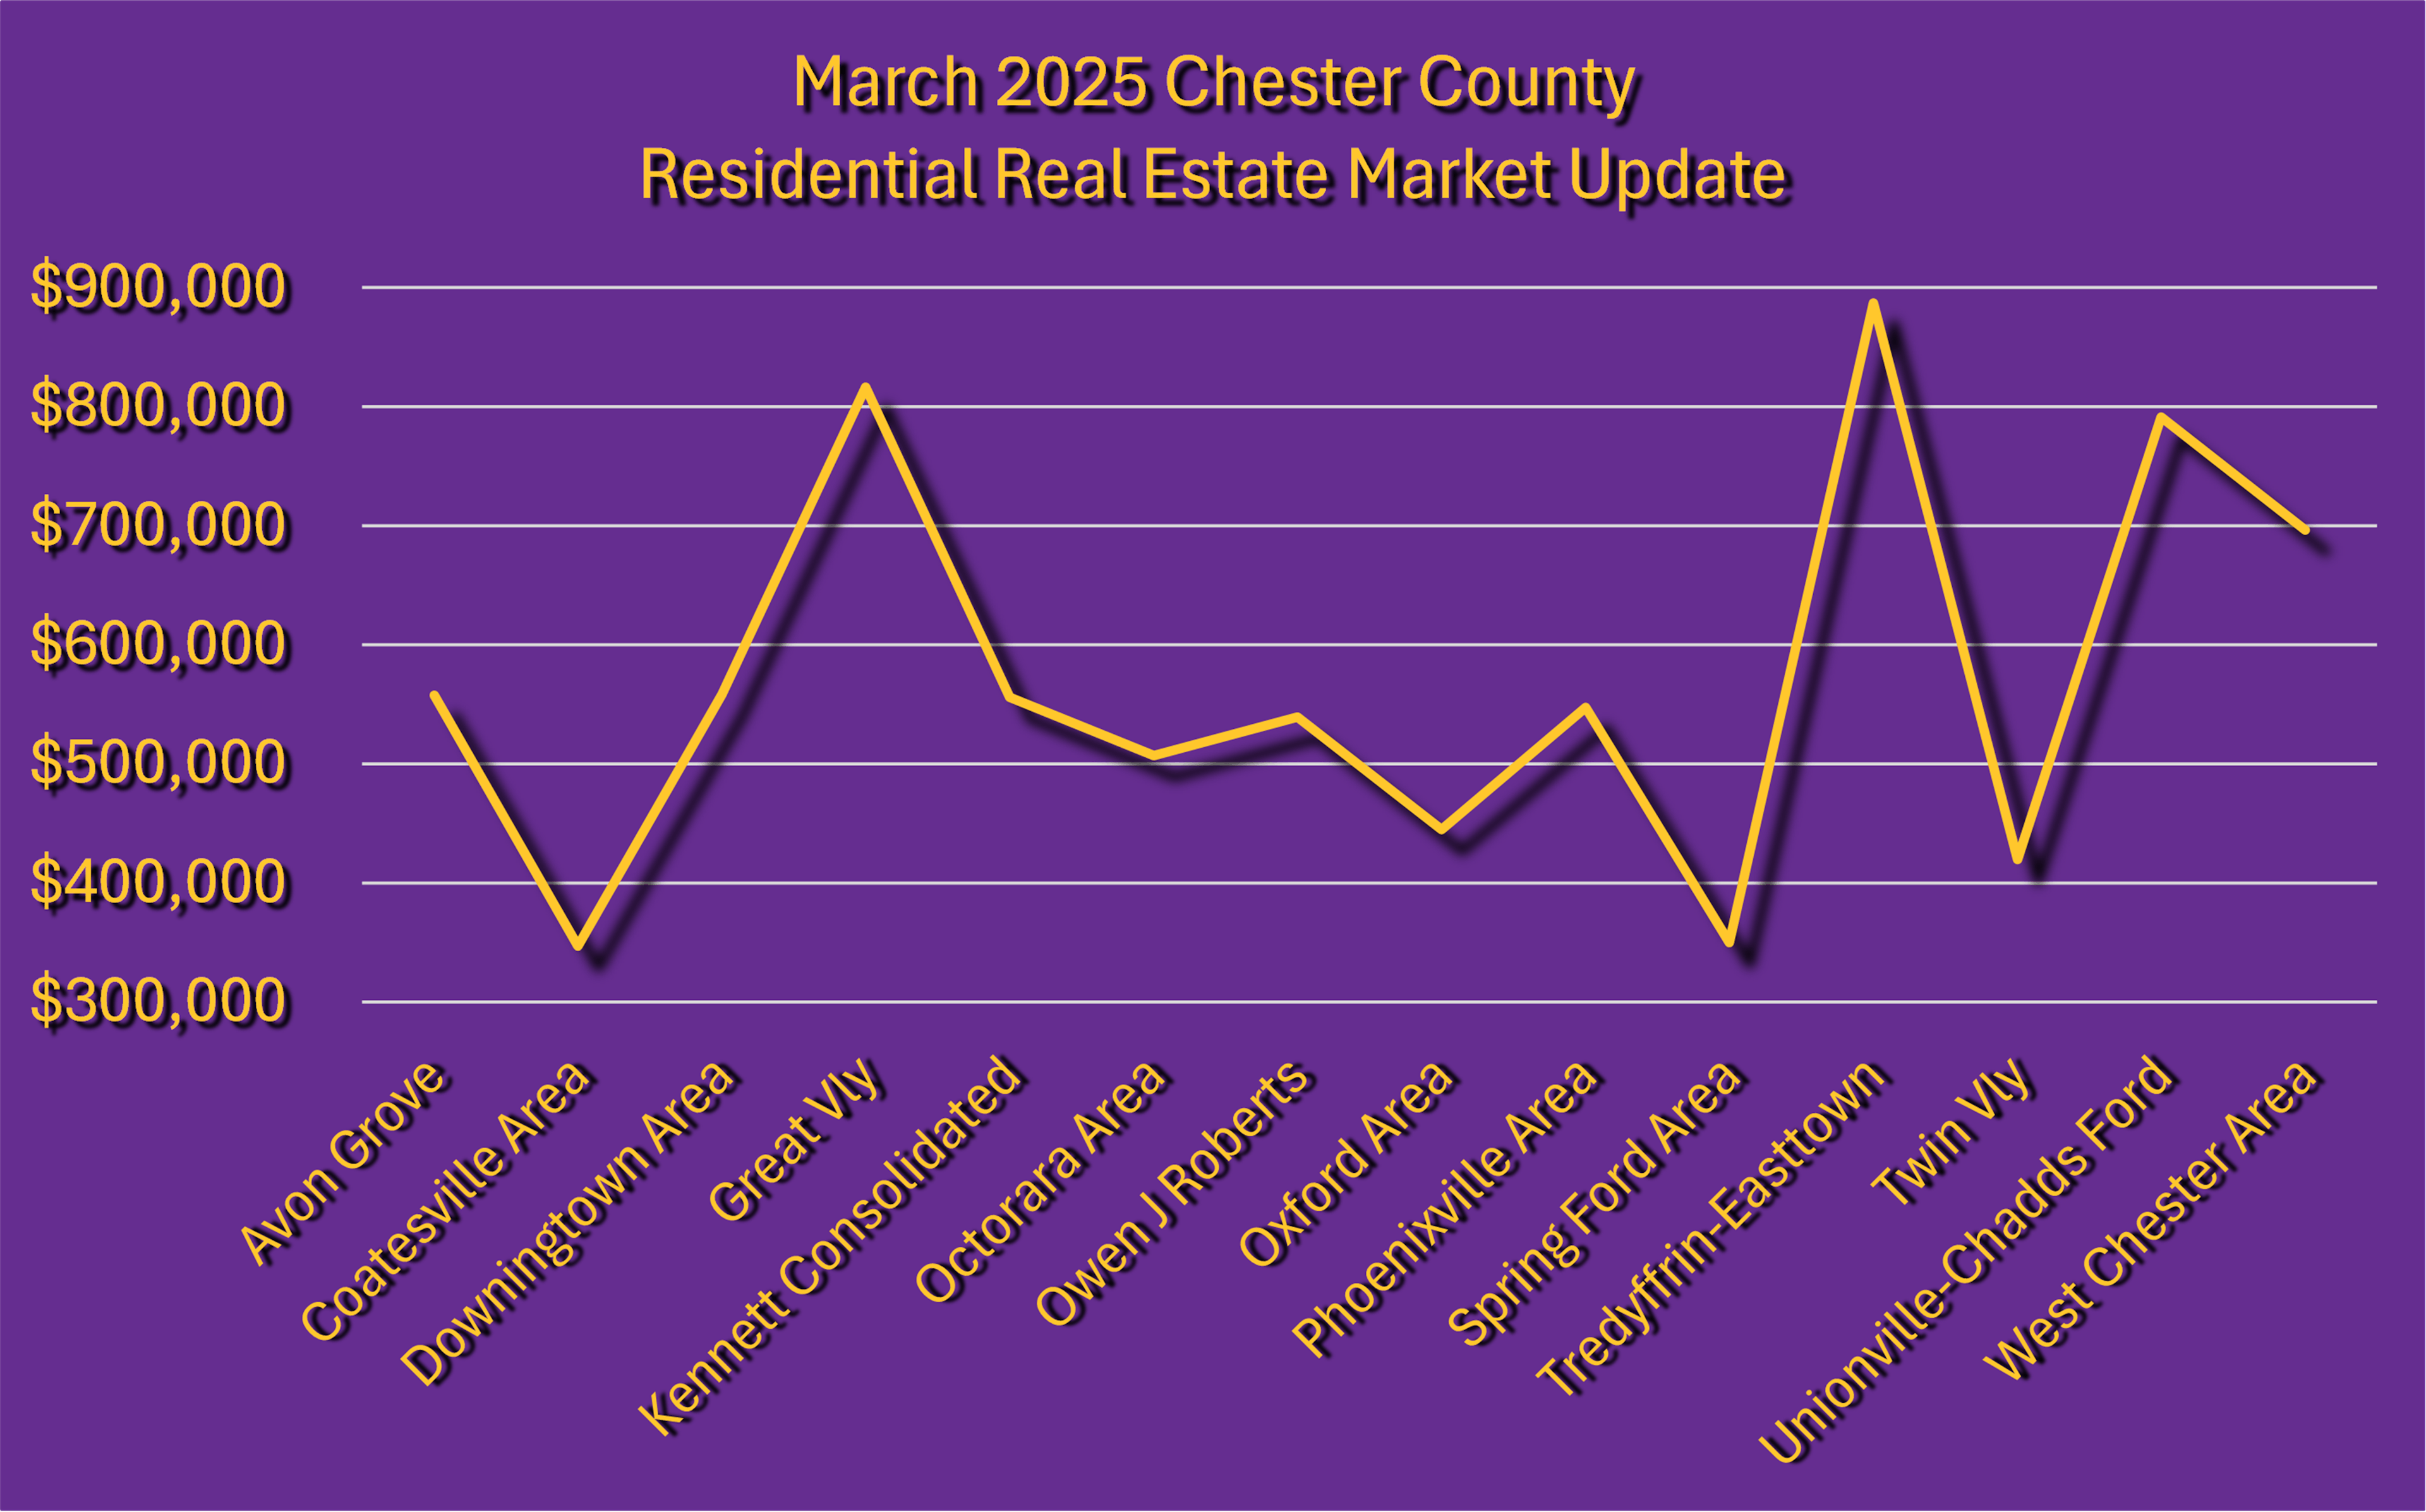
The table presented as an image below visually represents the same sales data that is listed in the bullet points above. The table format organizes the information into rows and columns, which can sometimes make it easier to comprehend at a glance. However, the image-based table might be less accessible or clear for readers on mobile devices compared to the text-based bulleted list. Please reach out for a PDF version of the table to be emailed.

In summary, the Chester County residential real estate market in March 2025 showed increased activity, higher prices, and faster sales compared to February, continuing the trend of a competitive market.
Please feel free to reach out if you have any questions or would like a more detailed analysis of specific areas.
*All information in this report has been collected from Bright MLS and is deemed reliable but not guaranteed. The Broker makes no representations or warranties, express or implied, regarding the accuracy, completeness, or reliability of the data provided. This information is subject to errors, omissions, and data entry inaccuracies, including but not limited to those from cooperating brokers participating in Bright MLS. Additionally, this report does not account for off-market transactions, private sales, or transactions conducted outside of Bright MLS.
This report is for informational purposes only and should not be construed as real estate advice. Individual circumstances vary, and real estate decisions should be based on professional guidance tailored to your specific situation. Please contact Trago Realty or your real estate agent to discuss your particular situation and/or needs.